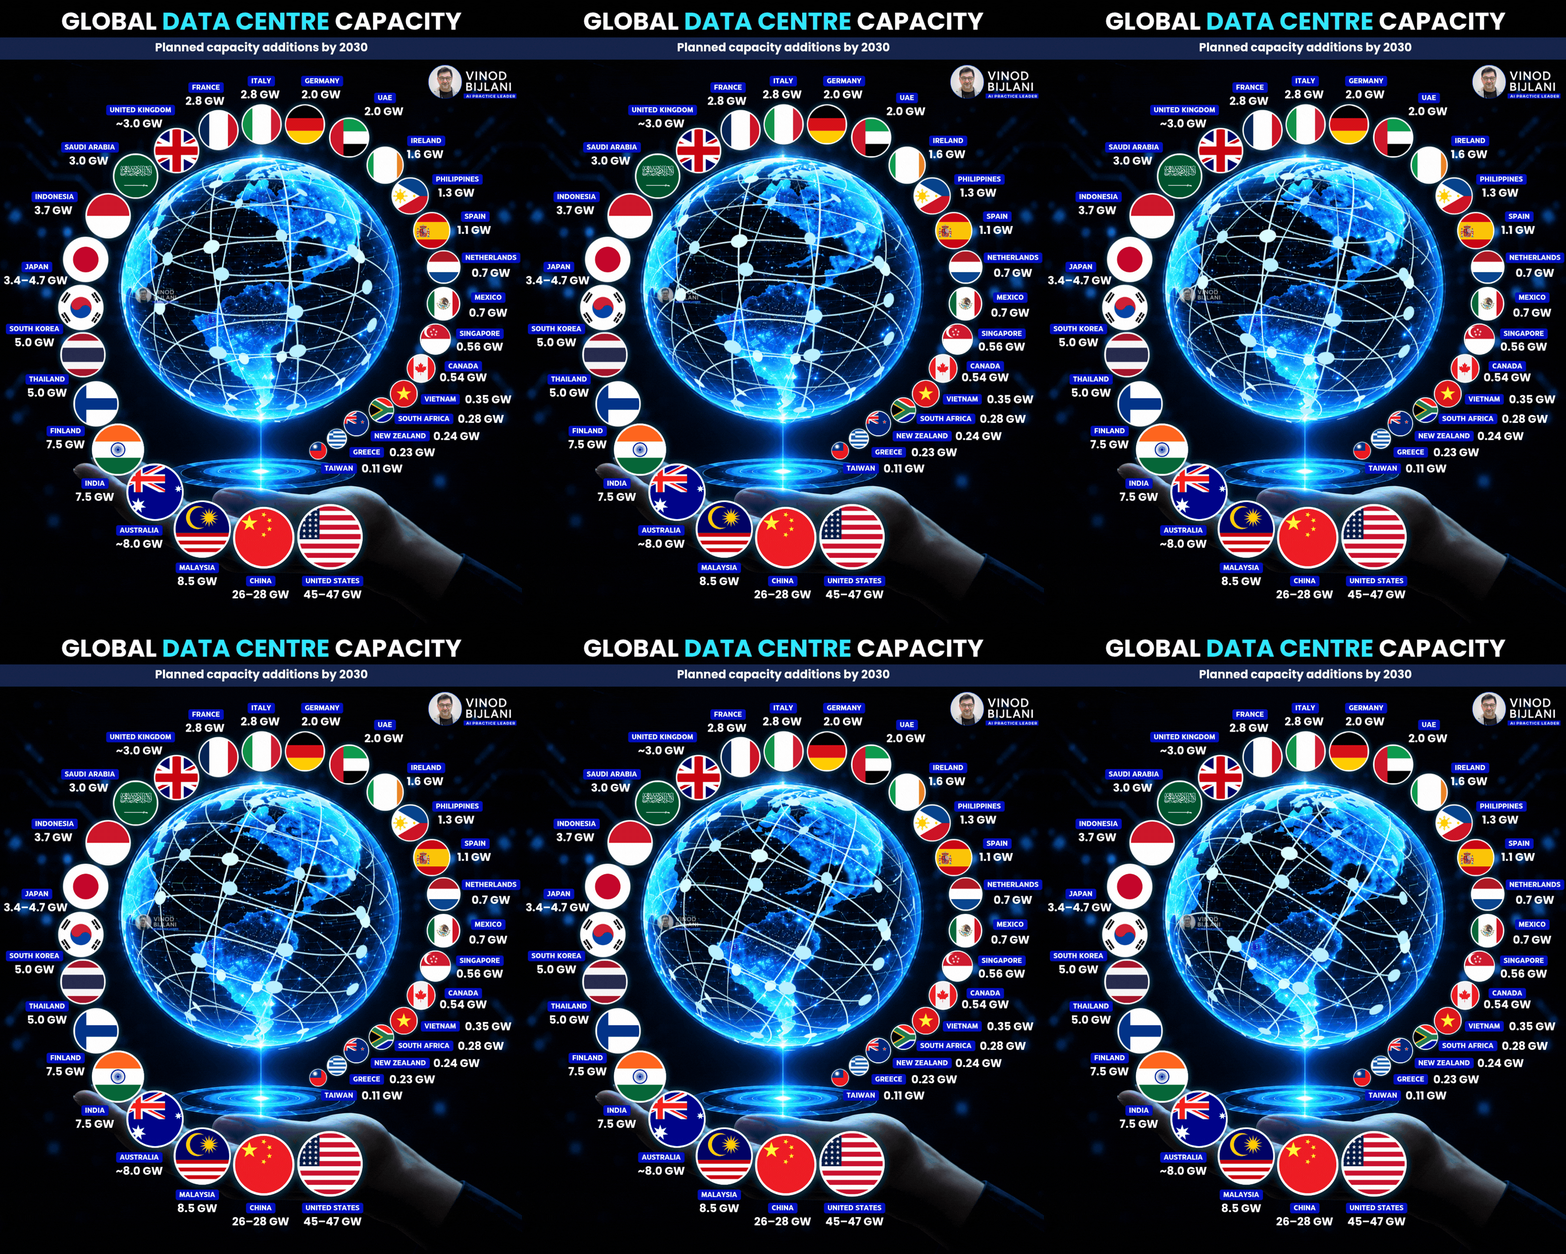
More than 100 GW of new data centre capacity is planned across just six markets. How much will actually come online by 2030?
My last posts mapped operational capacity across 20 markets as of June 2026. This time I looked at the buildout ahead, and how much of it is real.
The two giants. The United States goes from about 48 GW today to 114–118 GW by 2030 (BNEF): 66 to 70 GW more. China goes from about 32 GW to about 60 GW (Rystad): around 28 GW more.
The pipelines that stand out:
- Malaysia: 8.5 GW in Knight Frank's pipeline, and that is Johor alone.
- India: an 8.3 GW pipeline against 1.6 GW live, with nearly two-thirds at an early stage.
- Australia: about 23 GW announced, but CBA puts the feasible pipeline at about 7 GW.
- Finland: a pipeline nearly ten times its current footprint.
These are pipelines, not delivery schedules. Many projects have no confirmed completion date, and the figures cover both AI and conventional workloads.
The gap between announced and energised is already showing. The IEA says around 20% of planned data centre projects are at risk of grid delays. In Europe, the pipeline implies about 130% growth, while the IEA models about 70% by 2030. Bloomberg reports that a third to a half of US capacity planned for 2026 has been delayed or cancelled. And Microsoft recently walked away from a UK AI site after its grid connection slipped into the 2030s.
Power, transformers, financing, local opposition and the real pace of AI demand will decide the final number.
What is your prediction? What share do you think will be live by 2030 — under 50%, 50 to 75%, or more than 75% — and what will be the bottleneck?